Technology is changing the way we work, live, and interact with each other. The pace of technological change is much faster than it has been in the past. For example, it took 2.4 million years to control and use fire for cooking and only 66 years from the first powered flight to landing on the moon (World Economic Forum, 2023). This fast-paced industrial growth is also termed the Fourth Industrial Revolution Industry 4.0. It is marked by advanced technologies such as the Internet of Things (IoT), Artificial Intelligence (AI), Big data, and analytics, among others (Frank, 2024). Traditional leadership qualities will not work in this fast-paced world of change, i.e., Industry 4.0, so this paper will explore what makes an effective leader in this ever-changing technological and digitalized world, which is called Leadership 4.0.
Discussion/Analysis of the Question
Daft (2018) defines leadership as “Leadership is an influence relationship among leaders and followers who intend real changes and outcomes that reflect their shared purposes” (p. 4). Becoming a great leader is a journey of continuous learning and growth. It is a process — one that thrives on embracing challenges, seeking feedback, fostering connections, and cultivating understanding. On a day-to-day basis, leaders face challenges like operational issues, financial issues, remote work and learning, social and racial injustices, climate issues, technological advancements, and economic uncertainties. To face issues like these, leaders need to have a set of qualities to navigate their teams through these issues. Some of the essential qualities a leader should have are vision, self-awareness, respect, communication, collaboration, influence, integrity, courage, gratitude, and resilience (Leis & Wormington, 2024).
However, as the world is going through a fast pace of technological advancement and digitization, which is being termed Industrial Revolution 4.0, are the qualities of effective leadership mentioned above enough, or do leaders of today need additional qualities to be successful and navigate their organization through this change? In the context of Industry 4.0, effective leaders need additional qualities to ensure that their organization successfully navigates through this transformation, and here are some key qualities that the leaders of today should have (Microsoft, 2024).
1. Comfortable with data – Leaders need to make decisions based on data and feel comfortable and interpret what data tells them. Some key skills are.
a. Data literacy: Leaders need to understand basic data concepts, such as how to read graphs, interpret charts, and analyze trends. They also need to understand data-driven reports and use them to inform decisions.
b. Quantitative skills: Leaders do not need to be expert statisticians or do not need a degree in statistics, but they should have a grasp of quantitative methods. This includes understanding percentages, averages, and correlations.
c. Critical thinking: Leaders need to ask questions like: What does this data reveal? Are there any biases? How can we use this information strategically? In this way, leaders can avoid making decisions solely based on intuition or anecdotal evidence.
d. Data-driven decision-making: Effective leaders use data to ensure they make the right decisions. Instead of relying solely on gut feelings, they seek data and evidence to ensure they make the right decisions.
2. Long-term vision for technology – Leaders need to have a vision as to how these advanced technologies can protect and grow the organization’s market position and capitalize on any opportunities to make investments to drive disruption.
3. Aggressiveness in workforce development – Leaders need to invest in developing their current workforce so that their team members have the right skill set in data, technology, etc., to grow in the Industry 4.0 revolution.
Web 3 or Web 3.0 is much talked about and is quickly taking traction in he technology and financial savvy groups, but what actually is Web 3.
Let’s start from the beginning.
The first version of the internet that was publicly available to use, the World Wide Web, is referred to as Web 1.0. Dating back to the early 90s, it was largely made up of static web pages connected by hyperlinks.
Then came Web 2.0, the age of the internet as a platform. We saw the rise of e-commerce and social media sites like Facebook, Twitter, and Instagram. People gained the ability to interact with online platforms and publish content of their own. Smartphones and cloud computing were major drivers of growth here.
Web 3.0 is the next stage in the evolution of the Internet, which is based on the concept of creating a decentralized ecosystem. It aims to harness the power of modern technologies such as AI, machine learning, and blockchain to solve problems in today’s internet/online ecosystem. Here are some of the key features of Web 3.0:
a) Decentralization: This is the core idea of Web 3.0. In Web 2.0, computers use HTTP in the form of unique web addresses to find information stored in a fixed location, usually a single server. Web 3.0 finds information based on its content, so it can be stored and distributed in multiple places at the same time. This would collapse the massive databases currently maintained by internet giants such as Meta and Google, giving users more control.
b) Trustless and Permission less: Web 3.0 is trustless (meaning a network in which participants can interact directly without a trusted intermediary) and permission less (meaning anyone can join without permission). As a result, Web 3.0 applications run on blockchains or decentralized peer-to-peer networks.
c) Artificial intelligence (AI) and Machine learning: Web 3.0 will also use machine learning, a branch of artificial intelligence (AI) that uses data and algorithms to mimic human learning and incrementally improve its accuracy.
d) Connectivity and Ubiquity: Web 3.0 is designed to be more connected and ubiquitous than its predecessors. It will enable devices to communicate with each other and share data more easily, creating a more seamless and integrated online experience.
e) Redefined Data Ownership: Web 3.0 aims to redefine data ownership by giving users more control over their data. This will be achieved through the use of blockchain technology, which provides a secure and transparent way to store and share data.
Web 3.0 is still in its early stages, and its full potential is yet to be realized. However, it is clear that Web 3.0 has the potential to revolutionize the way we interact with the internet and each other.
First, there was web1 – as the story goes, was the era of decentralized, open protocols, in which most online activity involved navigating to individual static webpages. Web 2.0, which we’re living through now, is the era of centralization, in which a huge share of communication and commerce takes place on closed platforms owned by a handful of super-powerful corporations. Web3 is supposed to break the world free of that monopolistic control, But what is it, exactly?
At the most basic level, Web3 refers to a decentralized online ecosystem based on the blockchain. Platforms and apps built on Web3 won’t be owned by a central gatekeeper, but rather by users, who will earn their ownership stake by helping to develop and maintain those services.
Following are few core principles that guide its creation.
Web3 is decentralized: Instead of large swathes of the internet controlled and owned by centralized entities, ownership gets distributed amongst its builders and users.
Web3 is permission less: everyone has equal access to participate in Web3, and no one gets excluded.
Web3 has native payments: it uses cryptocurrency for spending and sending money online instead of relying on the outdated infrastructure of banks and payment processors.
Web3 is trustless: it uses cryptocurrency for spending and sending money online instead of relying on the outdated infrastructure of banks and payment processors
Digital technologies are transforming economies, creating jobs, and improving lives. They have dramatically changed the way we live, work, communicate, business, health, education, finance, and much much more.
Yet the digital divide remains stark and is becoming synonymous with a development divide. Billions of people around the world are still offline, and digital advancement has been uneven, exacerbating the gap between the digital haves and the have-nots.
World Bank has recently published digital progress and trends report for 2023. This report tracks the global progress of digitalization and countries’ production and use of digital technologies, from digital jobs, digital services exports, and app development to internet use, affordability, quality, and more.
The report also highlights policy shifts and debates, with a focus on developing countries. Two clear trends have emerged that are shaping our digital future: the importance of digital public infrastructure and the transformative emergence of artificial intelligence.
Closely measuring digital progress, especially in developing countries, will help policymakers and the private sector best direct their efforts to close the digital divide.
Augmented Reality (AR) is the state-of-the-art technology that can help keep your business competitive, bridge the physical and digital worlds to better guide and train employees, solve problems faster, optimize efficiencies, improve productivity and collaboration, and better prepare for the future.
But what actually is AR?
AR is an enhanced, interactive version of a real-world environment achieved through digital visual elements, sounds, and other sensory stimuli via holographic technology. AR incorporates three features: a combination of digital and physical worlds, interactions made in real time, and accurate 3D identification of virtual and real objects.
While there are many uses for AR in our everyday lives, following are some examples.
1) Enhanced navigation systems use augmented reality to superimpose a route over the live view of the road.
2) During football games, broadcasters use AR to draw lines on the field to illustrate and analyze plays.
3) Furniture and housewares giant IKEA offer an AR app (called IKEA Place) that lets you see how a piece of furniture will look and fit in your space.
4) Military fighter pilots see an AR projection of their altitude, speed, and other data on their helmet visor, which means they don’t need to waste focus by glancing down to see them.
5) Neurosurgeons sometimes use an AR projection of a 3-D brain to aid them in surgeries.
6) At historical sites like Pompeii in Italy, AR can project views of ancient civilizations over today’s ruins, bringing the past to life.
7) Ground crew at Singapore’s airport wear AR glasses to see information about cargo containers, speeding up loading times.
Augmented reality creates an immersive experience for all its users. There are five significant components of AR:
A) Artificial intelligence. Most augmented reality solutions need artificial intelligence (AI) to work, allowing users to complete actions using voice prompts. AI can also help process information for your AR application.
B) AR software. These are the tools and applications used to access AR. Some businesses can create their own form of AR software.
C) Processing. You’ll need processing power for your AR technology to work, generally by leveraging your device’s internal operating system.
D) Lenses. You’ll need a lens or image platform to view your content or images. The better quality your screen is, the more realistic your image will appear.
E) Sensors. AR systems need to digest data about their environment to align the real and digital worlds. When your camera captures information, it sends it through software for processing.
One critical thing that impacts each and every one of us is stability in the financial system, and any challenges in this, impacts economic development, investor confidence and overall quality of life.
Financial stability risks have increased rapidly as the resilience of the global financial system has faced a number of tests. The failures of Silicon Valley Bank and Signature Bank of New York and the loss of confidence in Credit Suisse are powerful reminders of the challenges posed by the interaction between tighter monetary and financial conditions and the buildup in vulnerabilities since the global financial crisis.
Rising geopolitical tensions have intensified concerns about global economic and financial fragmentation. Geopolitical tensions have increased globally over the past few years amid deteriorating diplomatic ties between the countries. Geopolitical factors may already be influencing the global economic and financial landscape. Several studies document that geopolitical factors matter for international trade linkages and that global trade has declined in recent years after major countries imposed new restrictions on the exchange of goods and services.
To counter the above risks.
A) Policymakers need to be aware of potential financial stability risks associated with a rise in geopolitical tensions and devote resources to their identification, quantification, management, and mitigation.
B) Based on the assessments of geopolitical risks, banks and nonbank financial institutions may need to hold adequate capital and liquidity buffers to mitigate the adverse consequences of rising geopolitical risks.
C) In the face of rising geopolitical tensions, the adequacy of the global financial safety net needs to be ensured through strong levels of international reserves held by countries, bilateral and regional financial arrangements, and precautionary credit lines from international financial institutions.
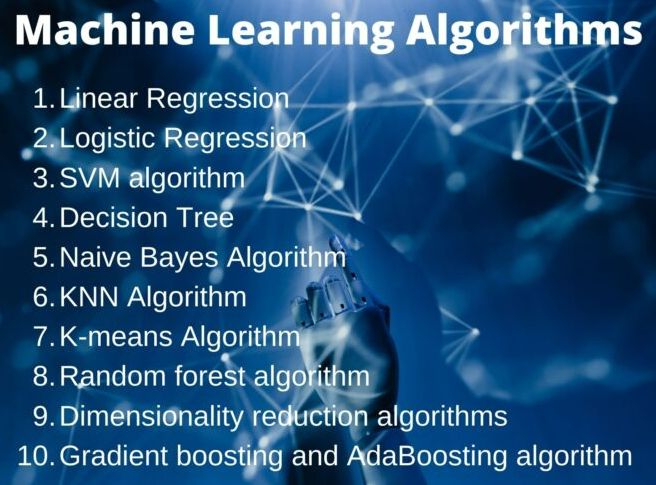
Machine learning is a branch of artificial intelligence (AI) and advance analytics which focuses on the use of data and algorithms to imitate the way that humans learn, gradually improving its accuracy.
Algorithms are the fundamental building blocks for machine learning models. From classification to regression, here are seven algorithms’ organizations need to know as they begin their ML journey:
1) Linear regression is a supervised learning algorithm used to predict and forecast values within a continuous range, such as sales numbers or prices.
2) Logistic regression, or “logit regression,” is a supervised learning algorithm used for binary classification, such as deciding whether an image fits into one class or another.
3) Naive Bayes is a set of supervised learning algorithms used to create predictive models for either binary or multi-classification. Based on Bayes’ theorem, Naive Bayes operates on conditional probabilities, which are independent of one another but indicate the likelihood of a classification based on their combined factors.
4) Decision tree is a supervised learning algorithm used for classification and predictive modeling.
5) Random forest algorithm uses an ensemble of decision trees for classification and predictive modeling.
6) K-nearest neighbor is a supervised learning algorithm used for classification and predictive modeling.
7) K means is an unsupervised algorithm used for classification and predictive modeling. Much like KNN, K means uses the proximity of an output to a cluster of data points to identify it. Each of the clusters is defined by a centroid, a real or imaginary center point for the cluster. K means is useful on large data sets, especially for clustering, though it can falter when handling outliers.
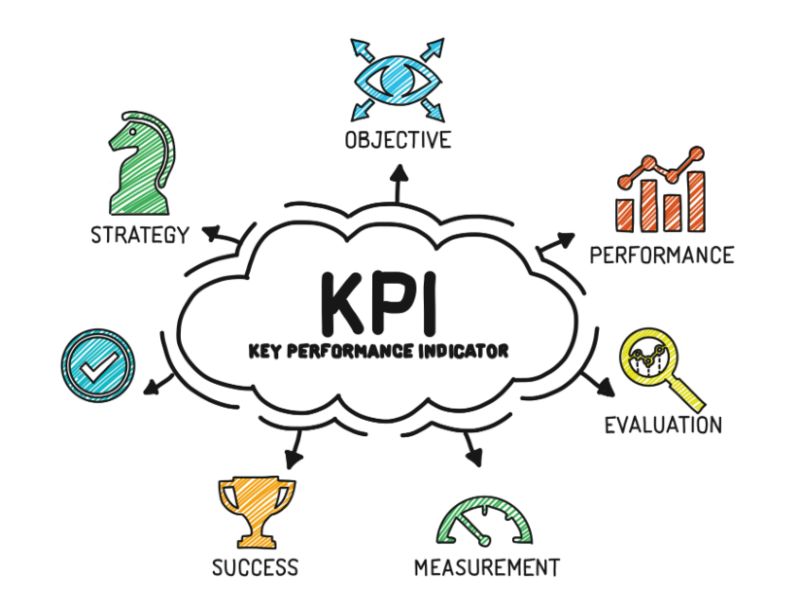
Even though organizations spend millions of dollars on the similar initiatives, still too often they struggle to achieve the desired outcomes. While there are number of reasons, but one of the key one is that they don’t have the right Key performance Indicators (KPI’s) at the business case level and then at the operational level.
Peter Drucker famously said, “What gets measured gets done.” Measurement is an essential management tool, as it helps us determine if our work is making an impact, demonstrate value, manage resources, and focus improvement efforts.
Key Performance Indicators (KPIs) are the critical (key) quantifiable indicators of progress toward an intended result. KPIs provide a focus for strategic and operational improvement, create an analytical basis for decision making and help focus attention on what matters most.
Managing with the use of KPIs includes setting targets (the desired level of performance) & thresholds, and then tracking progress against those. Guidelines for setting up some good tangible KPI’s are.
1) Provide objective evidence of progress towards achieving a desired outcome.
2) KPIs can be financial, including net profit (or the bottom line, gross profit margin), revenues minus certain expenses, or the current ratio (liquidity and cash availability).
3) Customer-focused KPIs generally center on per-customer efficiency, customer satisfaction, and customer retention.
4) Process-focused KPIs aim to measure and monitor operational performance across the organization.
5) Measure what is intended to be measured to help inform better decision making.
6) Can track efficiency, effectiveness, quality, timeliness, governance, compliance, behaviors, economics, project performance, personnel performance or resource utilization.
7) Are balanced between leading and lagging indicators.
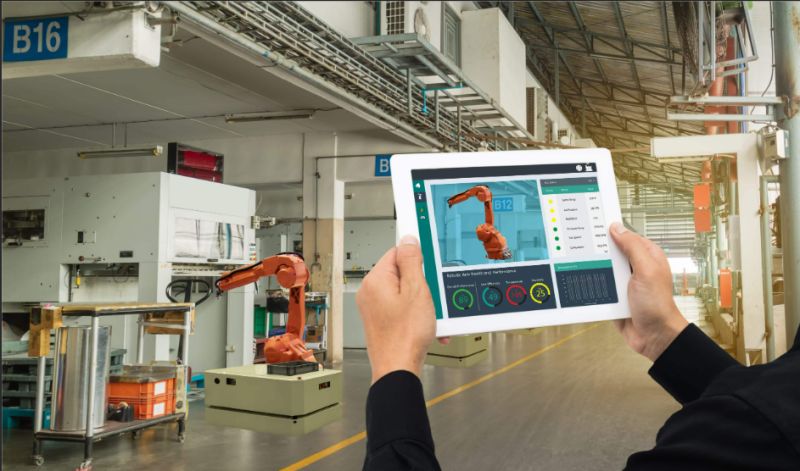
Amongst all the technologies, digital twin is one of the technologies that is quickly becoming part of our everyday life, but what really is digital twin.
A digital twin is a virtual representation of a real-world object or system. These virtual models are used to digitally represent performance, identify inefficiencies, and design solutions to improve their physical counterparts.
Businesses and organizations use digital twins to design, build, operate, and monitor product lifecycles. Equipped with up-to-date data on physical objects, digital twins can be paired with AI and machine learning to create detailed predictive models and forecast more accurate outcomes than most simulations.
Digital twin benefits
There are as many benefits to using digital twins as there are applications for them. However, some of the most common benefits of using them include:
a) A digital twin could be an entire factory, a shopping mall, or even just a single important piece of equipment that needs to be closely monitored. It allows users to interact with that data, through augmented reality on a smart device or via computer, giving the flexibility to understand and control a system either in the office or in the field.
b) Predictive maintenance – Since the twin system’s IoT sensors generate big data in real time, businesses can proactively analyze their data to identify problems within the system. This ability enables businesses to more accurately schedule predictive maintenance, thus improving production line efficiency and lowering maintenance costs.
c) Lower overall costs by designing, testing, and refining products or systems in virtual environments before mass production or roll-out.
d) Improve operational efficiency by modeling systems with up-to-date information, testing alterations in dynamic simulations, and ultimately implementing real-world changes.
We’ve seen it used numerous times, from the cover of prominent publications to speeches by Fortune 500 CEOs and world leaders: “data is the new oil”.
For data to create value and economic benefits for the organization, it must pass through various steps from data collection, cleansing, storage, governance, visualization, analysis, and the last and most important step decision making.
Too often organizations will start on data analysis journey, will spend tons of resources on data infrastructure & analysis, but will not go to the last step of making decisions based on data.
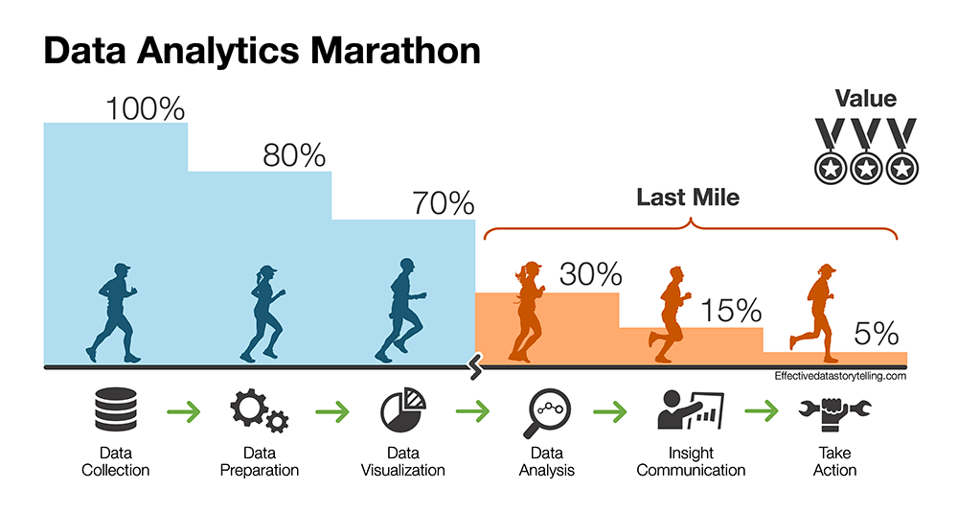
Brent Dykes in the article Data analytics marathon has very nicely drawn the parallels of data analysis journey and running the marathon and why the last step is the most critical one.
Here are the steps in data analytics marathon.
1. Data collection. You collect all kinds of raw data on your business operations from different sources. Much of this data will be generated automatically regardless of whether you want it or not. Some of your data may require thought and effort (strategy) to be captured correctly so it can address critical business questions.
2. Data preparation. Before you can use your data, it must be cleansed, combined and formatted for reporting and analysis purposes. Without accurate and consistent data, it’s going to be difficult to obtain valuable insights from what’s collected.
3. Data visualization. To monitor business performance, your data must be visualized in reports and dashboards. By sharing this summarized information throughout your organization, managers and employees will be able to observe how different aspects of the business are performing.
4. Data analysis. To gain deeper insights into the business, your people will need to explore the data for potential issues or opportunities. An iterative process of data discovery will help your organization unlock insights that can lead to enhanced business performance.
5. Insight communication. To ensure the insights drive the right decisions and actions, they must be communicated effectively. Data storytelling opens the audience’s minds to new possibilities, using engaging narratives and clear visuals to explain key insights.
6. Take action. The last crucial step is to decide which insights should be pursued and then implement the necessary changes. In some cases, you may deploy a test first to verify the results before making wholesale alterations. Regardless, you’ll want to assess the results after each change and learn from them.